Linking datasets: 360 Giving Data
Published:
Overview
In previous blog posts, we have described the creation of our foundational spine and how it can be linked to closed data sources such as the Serious Incident Reporting scheme operated by the Office of the Scottish Charity Regulator (OSCR). In this blog post, we outline an example analysis carried out by linking organisations in our foundational spine to an important source of open covariate data, namely the grant data curated by 360Giving. Our project aims to link a diverse range of data sources to our organisational spine, including the ONS Business Index, 360Giving grant data, and data held by the charity regulators (for example, data on charity finances and trustees). 360Giving provides a vast amount of open data on grants awarded to third sector organisations and as such, is an ideal data source to demonstrate the possible uses of our spine dataset. In this blog, we focus in on organisations registered with the Charity Commission for England and Wales (CCEW) and grants awarded between 2011 and 2023. In the sections that follow, we will provide some descriptive analyses on the amount of money awarded to organisations (broken down geographically and by area of charitable activity) as well as the main benefactors of grants in the 360G dataset.
Linking grants data
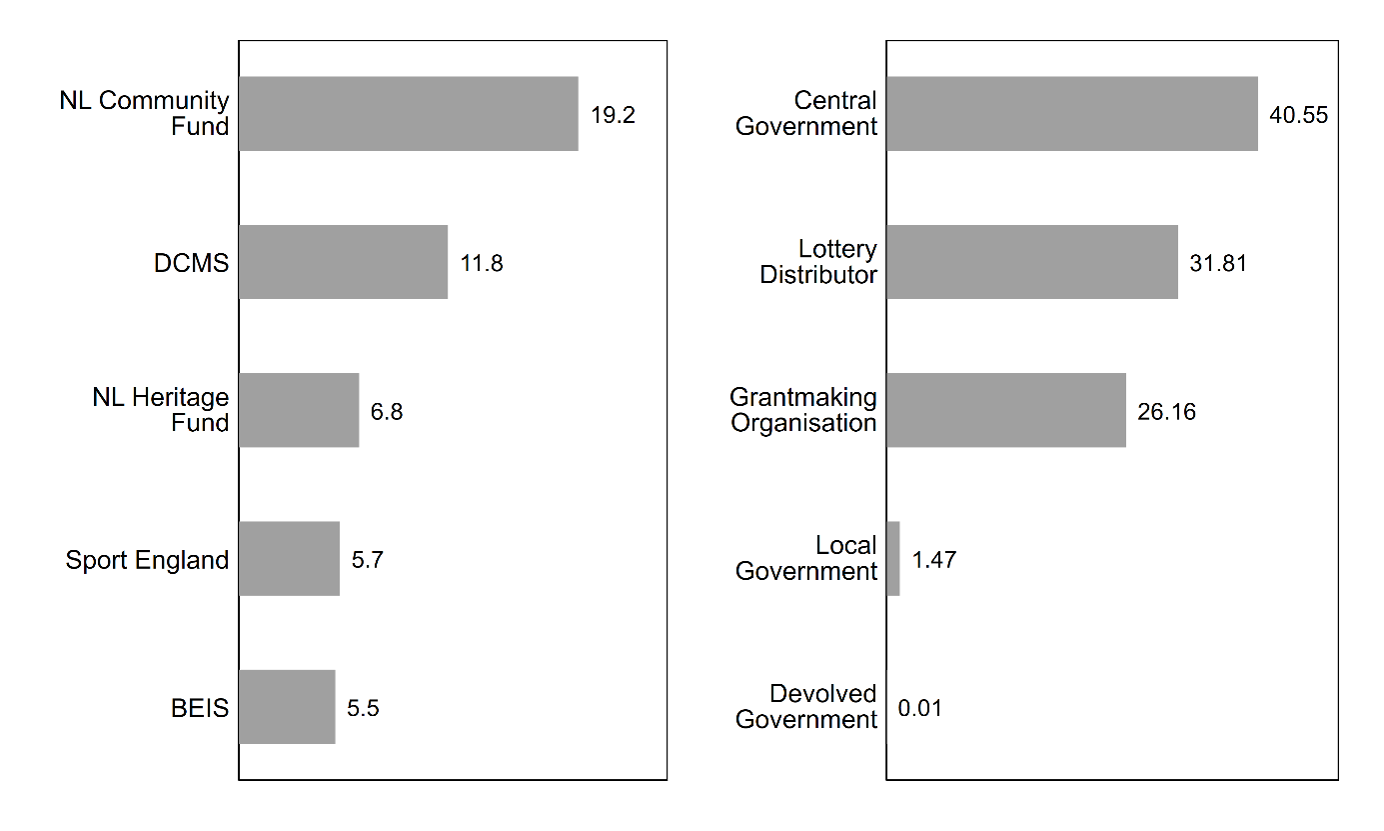
To link our organisational spine to 360G data, we downloaded a data extract from the 360G website1 . The extract used in this blog was downloaded on 13 August 2024 and contains data on 1,053,846 grants. We cleaned this data and matched it to our spine using CCEW ID and organisation name. This provided us with data on 343,965 grants for 64,399 distinct organisations registered with CCEW2 . We then kept only grants awarded between 2011–2023 and dropped observations where we did not have reliable geographical data. This left us with data on 269,334 grants, with a value of approximately £21.9 billion, for 47,868 organisations registered with the CCEW. The mean size of grants awarded in our data is £81,357 while the median value is £9,980. The mean number of grants awarded per organisation is 5.6 while the median value is two. In terms of benefactors, the data contains grants from 280 distinct funders. The mean number of grants per funding organisation is 962 with a median value of 193. Figure 1 below shows some more detail on the funders in our dataset. The largest single funder in the dataset is the National Lottery Community Fund (19.2 per cent) while the top five funders combined account for 49 per cent of the total grant value. We can also see in Figure 1 that 40.6 per cent of the total grant value was distributed by central government, 31.8 per cent by lottery distributors, 26.2 per cent by grantmaking organisations, and the remaining 1.5 per cent by devolved or local government.

Note: DCMS = Department for Digital, Culture, Media and Sport. BEIS = Department for Business, Energy and Industrial Strategy.
Table 1 adds additional detail on how these grants are distributed across categories of charitable activity using a version of the International Classification of Non-Profit Organisations scheme. This allows us to classify organisations into broader categories. Table 1 also provides data on how these categories are distributed across the English and Welsh charitable sector as a whole to allow for comparison.
| ICNPO category | % of total grant value | % of sector | |
|---|---|---|---|
| Culture, communication and recreation activities | 23.3 | 11.8 | +11.5 |
| Social services | 14.6 | 12.5 | +2.1 |
| Philanthropic intermediaries and voluntarism promotion | 13.8 | 21.1 | -7.3 |
| Civic, advocacy, political and international activities | 12.4 | 9.6 | +2.8 |
| Education services | 10.2 | 12.8 | -2.6 |
| Community and economic development, and housing activities | 9.0 | 11.1 | -2.1 |
| Human health services | 7.5 | 4.5 | +3.0 |
| Professional, scientific, accounting and administrative services | 4.6 | 1.4 | +3.2 |
| Religious congregations and associations | 2.9 1 | 4.0 | -11.1 |
| Environmental protection and animal welfare activities | 0.6 | 0.5 | +0.1 |
| Other activities | 0.5 | 0.3 | +0.2 |
| Business, professional and labour organizations | 0.5 | 0.4 | +0.1 |
Note: Figures for percentage of sector is based on CCEW register of active charities in March 2023.
An interesting descriptive finding here is that charities classified as being in the ‘Culture, communication and recreation activities’ category account for almost a quarter of the total value of grants, despite comprising just 11.8 per cent of the sector. Conversely, Religious congregations and associations attract just 2.9 per cent of grant funding despite making up 14 per cent of the English and Welsh charity register.
Geographical distribution of grants
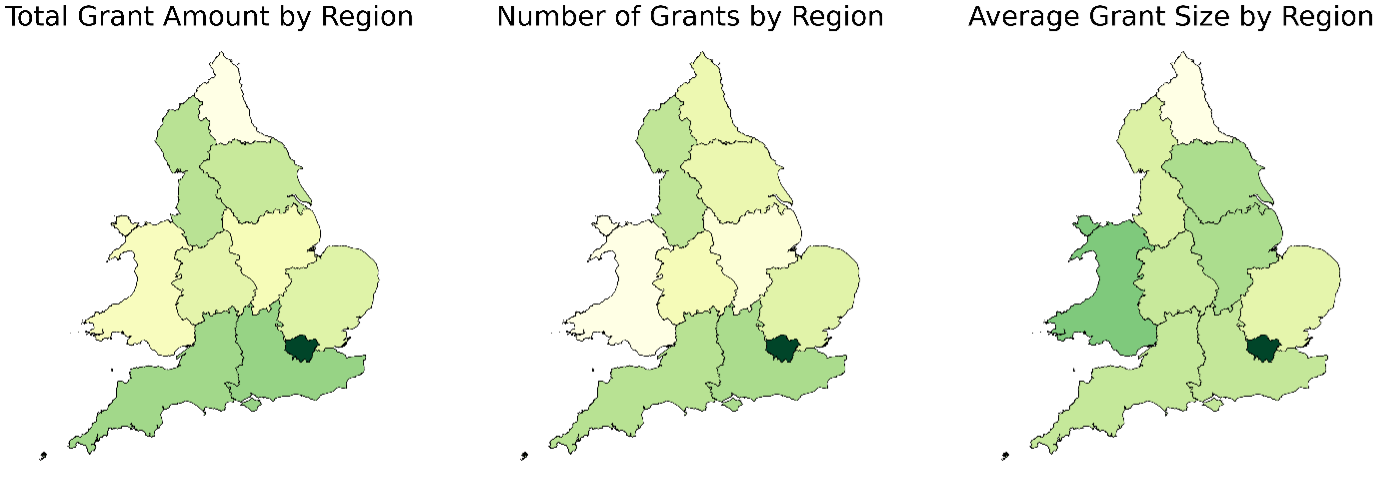
Below we add one additional layer of analysis by looking at the geographic distribution of the grants in our data. Figure 2 shows the geographic distribution of graphs in terms of total grant amount (left), number of grants awarded (centre), and average size of grants (right). Darker colours for a given region indicate higher values while lighter colours indicate the inverse. For example, in all three maps, we can see that the London region has the darkest hue. The first two maps indicate that both the total value of grants and the number of grants are unsurprisingly concentrated in London while the map on the right also indicates that the average grant awarded in London is larger than in other regions. Approximately £8.9 billion (40.7 per cent) of the grants in this data are awarded to organisations with a registered address in London, the next largest region in this measure is the South East with approximately £2.2 billion (9.9 per cent). At the other end of this scale is the North East region with approximately £760 million, accounting for just 3.5 per cent of the total grant value. Additionally, we can see in Figure 2 that the North East may find itself in last place because the average size of grants awarded is lower than all other regions (right) rather than winning less in terms of raw numbers of grants (centre). The mean value for grants awarded in the North East region stands at £36,346 with the next lowest region (East of England) being almost £20,000 higher on this measure.

Summary
In this blog post, we have linked an important source of open covariate data (360G grants) to our spine and have demonstrated how this data can be used to explore the important topic of grant funding for the charitable sector. In this short piece, we have just scratched the surface of possible analyses by looking at key funders, the allocation of grants based on area of charitable activity, and the geographic distribution of grants to English and Welsh charities. By linking our spine to several additional data sources such as the ONS Business Index and trustee data held by the charity regulators, we aim to produce a foundational database of UK third sector organisations that will allow users to build a holistic and integrated picture of the UK charitable sector. We hope this resource will make a significant contribution to the evidence base of the field and will be used to improve analysis of the third sector.
